Appendix A in the textbook also offers detailed guidance on how to make graphs.
How to use graph paper
You will prepare your graphs by hand using graph paper. This is to ensure that you acquire the skill of making proper graphs. Spreadsheet software like Excel also offer graphing features and are capable of producing fancy graphs, but such tools—with their default settings—cannot produce graphs appropriate for use in experimental reports or scientific articles.
However, if you wish, you may use spreadsheet programs or other software for data processing. Indeed, please use such tools as much as you like.
Use A4-size graph paper. Unless otherwise specified, do not cut out your graph; instead, just insert entire A4 sheets at the appropriate places in your report.
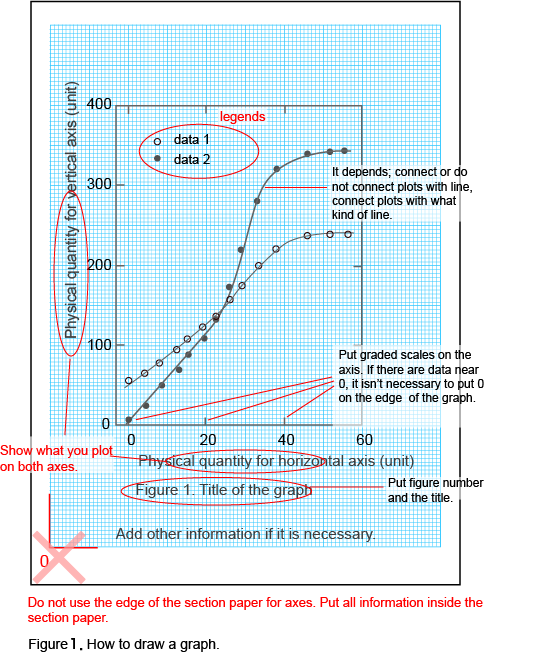
As shown in the figure, leave enough space to ensure that all necessary information fits within the grid lines. Do not write anything in the blank space lying outside the grid lines.
Vertical lines, horizontal lines, and gradations
From time to time we encounter students who, when drawing vertical lines, horizontal lines, or gradations, interpret the phrase “hand drawn” to mean “freehand,” thus yielding terrible-looking coordinate axes. Always use a ruler to produce nice, neat, straight lines for coordinate axes!
You may write numerals indicating coordinate gradations at a few appropriately-chosen points along the axes; there is no need to write these too finely. Always write the numeral “0” at the position of 0 on the coordinate axes. Draw gradation lines (scale lines) at the points at which you have attached gradation numerals. (The blue grid lines on their own do not suffice as gradation lines.)
When writing gradation numerals in cases where data values are extremely large or extremely small, you must account properly for significant digits. If you write numbers such as “10,000,” “20,000,” etc., you are expressing five significant digits. If your data in fact only have three significant digits, write numbers such as “10k,” “20k,” etc. instead (here the unit indicator “k” stands for “kilo”). Make sure to use indicators such as “k” (kilo-), “M” (mega-), “m” (milli-”) or “µm” (micro-) appropriately; in other cases, use indicators such as × 10 n.
Always specify units to indicate clearly what scientific quantities are represented by the horizontal and vertical axes.
Plotting Data
Plot data points using symbols of reasonable sizes (diameter roughly 2–4 mm) to make graphs easy to read. Symbols should be circles (filled or empty) centered at the data point.
In cases where it is possible to estimate the error range of the data, attach error bars to each symbol. See the textbook for a discussion of the proper procedure for adding error bars.
The questions of whether or not to connect data points with curves, and—if so—what sort of curves to use (theoretical curves, spline-interpolation curves, etc.) vary from case to case. Each project should offer guidance on these issues. If you are not sure what to do, please ask an instructor or TA.
Titles of graphs
Please indicate precisely what your graph is showing. Affix titles such as “Relationship between XX and YY” or “Dependence of XX on YY” or “Time variation of XX.” In general, titles should appear below graphs together with the figure number.
In addition to the title, add extra explanation as necessary. This is not always necessary, because in many cases the content of the graph will also be explained in the main text of your report.
[Note that, in addition to graphs, your report may include other figures such as diagrams of the experimental apparatus or flowcharts of the experimental procedure. Moreover, tables should be numbered (“Table 1,” “Table 2,” etc.) with the numbering scheme separate from that used for figures; for tables, the usual practice is to place titles above the tables.]
Legends
When plotting multiple datasets on the same graph, distinguish different datasets by using different symbols [hollow circles (◯), filled circles (●), double circles (◎), rectangles (◇, □), triangles (△, ▽), etc.] and include a legend indicating which symbol represents which dataset.